Sentiment: Bearish
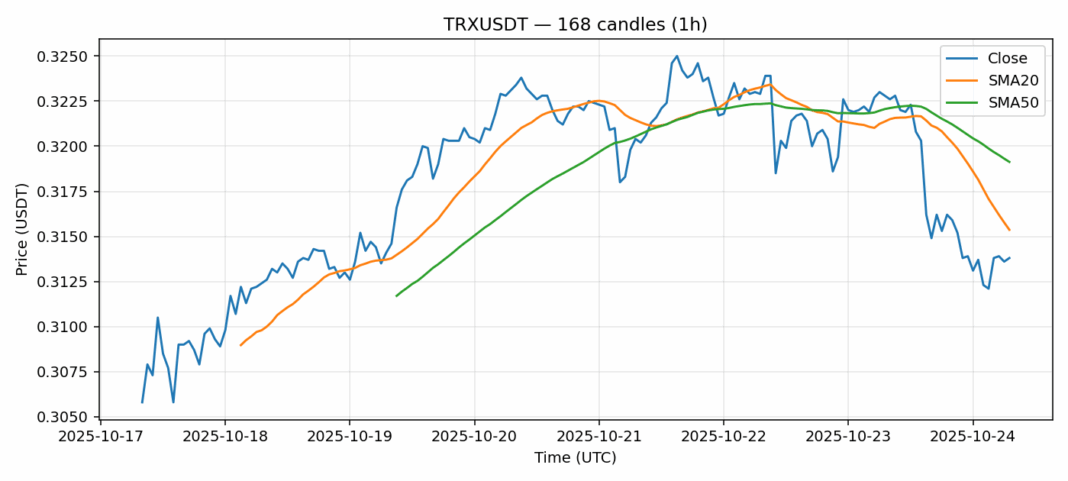
TRX is showing signs of technical weakness as it trades at $0.3138, down 2.79% over the past 24 hours. The current price sits below both the 20-day SMA ($0.3154) and 50-day SMA ($0.3191), indicating bearish momentum in the short to medium term. With RSI reading 37.5, TRX is approaching oversold territory but hasn’t yet reached the traditional 30-level that typically signals a potential reversal. The 24-hour trading volume of $111.7 million suggests moderate participation, while volatility remains elevated at 1.66%. Traders should watch for a potential bounce near the $0.31 psychological level, but any recovery would need to reclaim the 20-day SMA to suggest sustained bullish momentum. Current positioning favors cautious short-term trades with tight stop-losses, while longer-term holders might consider accumulating if RSI dips below 35.
Key Metrics
| Price | 0.3138 USDT |
| 24h Change | -2.79% |
| 24h Volume | 111678304.75 |
| RSI(14) | 37.50 |
| SMA20 / SMA50 | 0.32 / 0.32 |
| Daily Volatility | 1.66% |
TRON — 1h candles, 7D window (SMA20/SMA50, RSI).


