Sentiment: Bullish
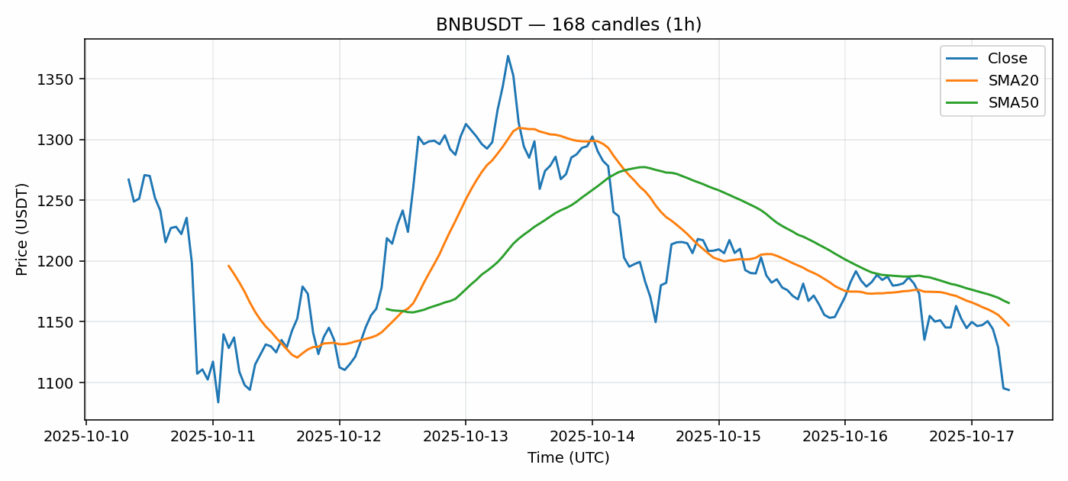
BNB is showing significant technical weakness as it trades at $1,093.50, down nearly 8% over the past 24 hours. The current price sits well below both the 20-day SMA ($1,147) and 50-day SMA ($1,165), indicating strong bearish momentum. However, the extremely oversold RSI reading of 24.93 suggests we may be approaching a potential reversal zone. Historically, RSI levels below 30 often precede short-term bounces. Volume remains substantial at $855 million, showing continued institutional interest despite the price decline. The high volatility reading of 6.92% indicates traders should expect continued price swings. For traders, consider scaling into long positions near current levels with tight stop losses below $1,050. Resistance awaits at the $1,150 level where the moving averages converge. This could present a logical take-profit zone for swing traders entering at these oversold conditions.
Key Metrics
| Price | 1093.5000 USDT |
| 24h Change | -7.94% |
| 24h Volume | 854962847.49 |
| RSI(14) | 24.93 |
| SMA20 / SMA50 | 1147.03 / 1165.53 |
| Daily Volatility | 6.92% |
BNB — 1h candles, 7D window (SMA20/SMA50, RSI).


