Sentiment: Bullish
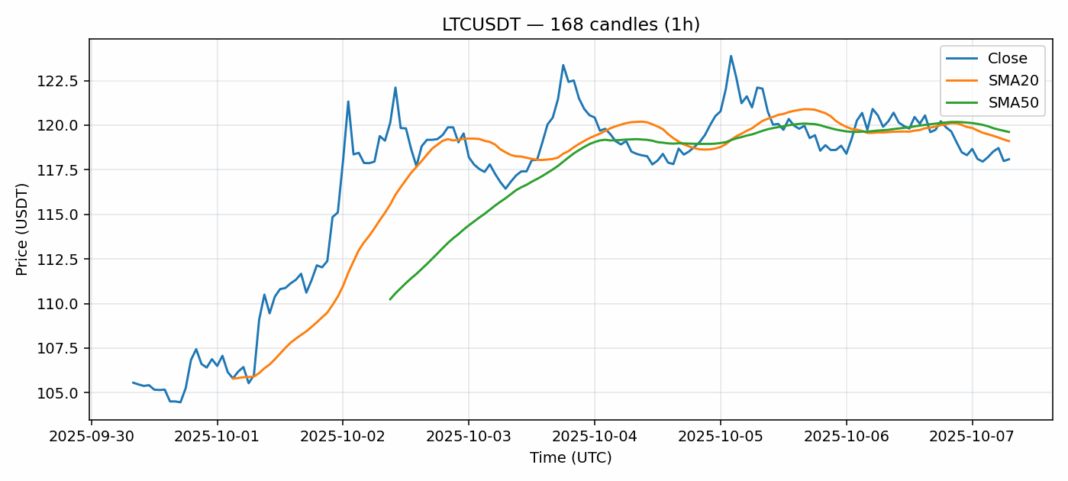
LTCUSDT is showing signs of potential exhaustion in its recent downtrend, currently trading at $118.09 with a 24-hour decline of 2.06%. The RSI reading of 33.6 indicates LTC is approaching oversold territory, which historically presents buying opportunities for swing traders. While price remains below both the 20-day SMA ($119.11) and 50-day SMA ($119.62), the narrowing gap between these moving averages suggests selling pressure may be easing. Daily volume of $48 million remains healthy, indicating continued market interest. Traders should watch for a decisive break above the $120 resistance level, which could signal a reversal toward $125. Consider accumulating positions near current levels with tight stop-losses around $115, while more conservative traders might wait for confirmation above the 20-day SMA before entering long positions. The elevated volatility of 3.5% suggests position sizing should be managed carefully.
Key Metrics
| Price | 118.0900 USDT |
| 24h Change | -2.06% |
| 24h Volume | 48008853.96 |
| RSI(14) | 33.60 |
| SMA20 / SMA50 | 119.11 / 119.62 |
| Daily Volatility | 3.51% |
Litecoin — 1h candles, 7D window (SMA20/SMA50, RSI).


