Sentiment: Bearish
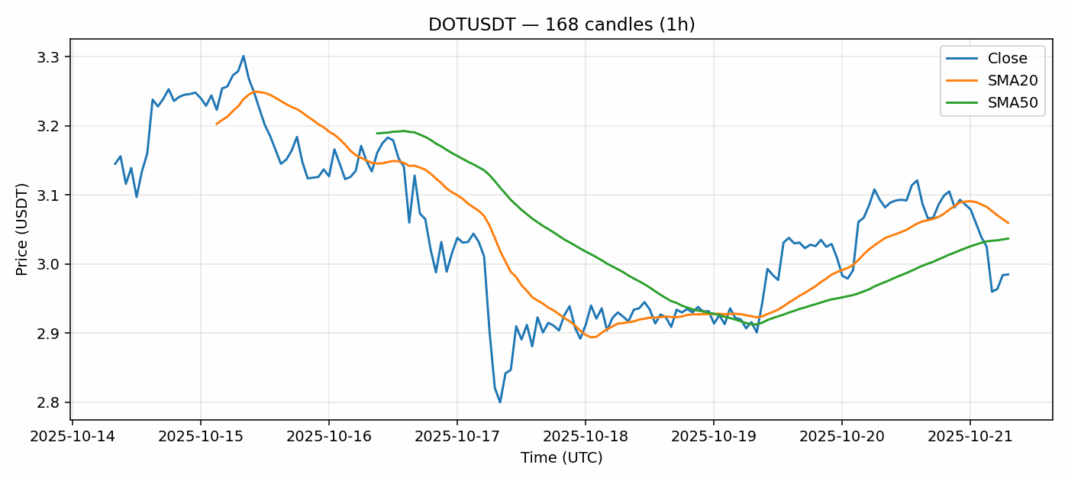
DOTUSDT is showing concerning technical signals as the token trades at $2.985, down 3.71% over the past 24 hours. The current price sits below both the 20-day SMA ($3.06) and 50-day SMA ($3.04), indicating sustained bearish momentum. However, the RSI reading of 32 suggests DOT is approaching oversold territory, which could present a potential buying opportunity for contrarian traders. Volume remains substantial at $18.6 million, showing continued market interest despite the price decline. The 4.23% volatility reading indicates moderate price swings, typical for altcoins in current market conditions. For traders, consider scaling into long positions around current levels with tight stop-losses below $2.85. Resistance awaits at the $3.04-3.06 SMA confluence zone, while a break above $3.10 could signal trend reversal. Risk management remains crucial given the broader market uncertainty.
Key Metrics
| Price | 2.9850 USDT |
| 24h Change | -3.71% |
| 24h Volume | 18586589.11 |
| RSI(14) | 32.17 |
| SMA20 / SMA50 | 3.06 / 3.04 |
| Daily Volatility | 4.23% |
Polkadot — 1h candles, 7D window (SMA20/SMA50, RSI).


