Sentiment: Bearish
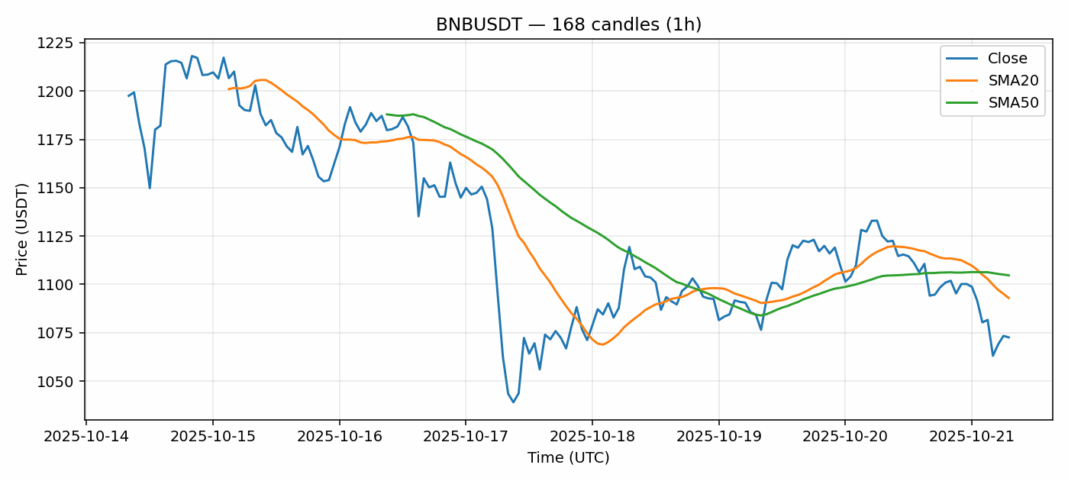
BNB is showing concerning technical signals as it trades at $1,072, down nearly 5% in the past 24 hours. The current price sits below both the 20-day SMA ($1,093) and 50-day SMA ($1,105), indicating sustained bearish pressure. The RSI reading of 34 suggests the asset is approaching oversold territory but hasn’t yet reached extreme levels that would signal a strong reversal opportunity. Trading volume remains substantial at over $500 million, showing continued market interest despite the downward move. The 4.3% volatility reading indicates moderate price swings, typical for BNB during corrective phases. For traders, this setup suggests caution – while the oversold RSI might tempt some bargain hunters, the price remaining below key moving averages indicates the downtrend remains intact. Consider waiting for a confirmed break above $1,100 with strong volume before entering long positions. Short-term traders might find opportunities in the volatility, but risk management remains crucial given the current bearish structure.
Key Metrics
| Price | 1072.5800 USDT |
| 24h Change | -4.99% |
| 24h Volume | 503513492.33 |
| RSI(14) | 34.07 |
| SMA20 / SMA50 | 1092.93 / 1104.67 |
| Daily Volatility | 4.33% |
BNB — 1h candles, 7D window (SMA20/SMA50, RSI).


