Sentiment: Neutral
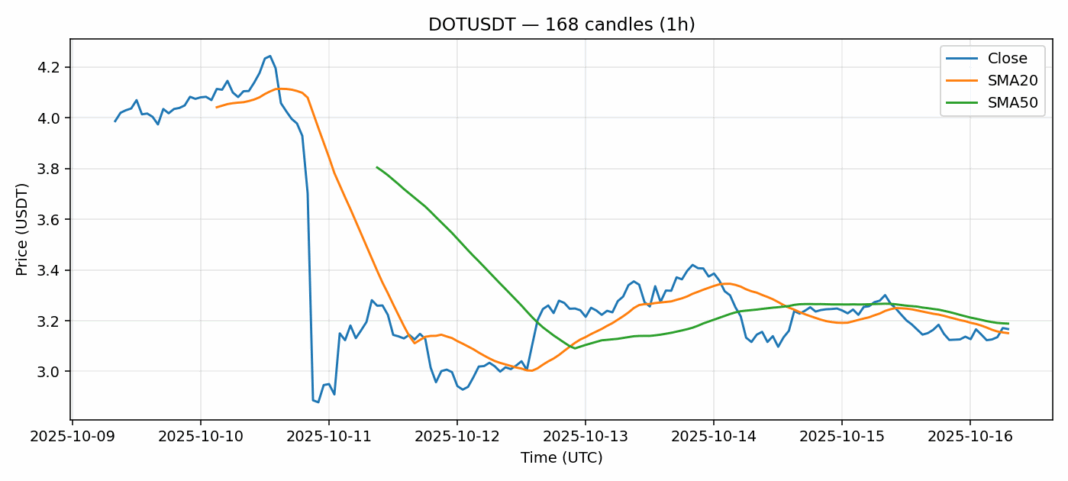
DOT is showing mixed signals after a 3% decline over the past 24 hours, currently trading at $3.167. The price action finds itself in a critical technical zone, sitting just above the 20-day SMA at $3.15 but below the 50-day SMA at $3.19. This positioning suggests the asset is at an inflection point where directional momentum could emerge. The RSI reading of 50.63 indicates neutral momentum, neither overbought nor oversold, giving room for movement in either direction. Trading volume of $27 million appears healthy but not exceptional, suggesting moderate institutional interest. The 11.4% volatility reading highlights DOT’s characteristic price swings. For traders, I’d recommend watching the $3.15 support level closely – a decisive break below could trigger further selling toward $3.00, while holding above this level might attract buyers targeting a retest of the $3.30 resistance zone. Consider scaling into positions with tight stops given the elevated volatility environment.
Key Metrics
| Price | 3.1670 USDT |
| 24h Change | -3.06% |
| 24h Volume | 27014293.05 |
| RSI(14) | 50.63 |
| SMA20 / SMA50 | 3.15 / 3.19 |
| Daily Volatility | 11.42% |
Polkadot — 1h candles, 7D window (SMA20/SMA50, RSI).


