Sentiment: Bullish
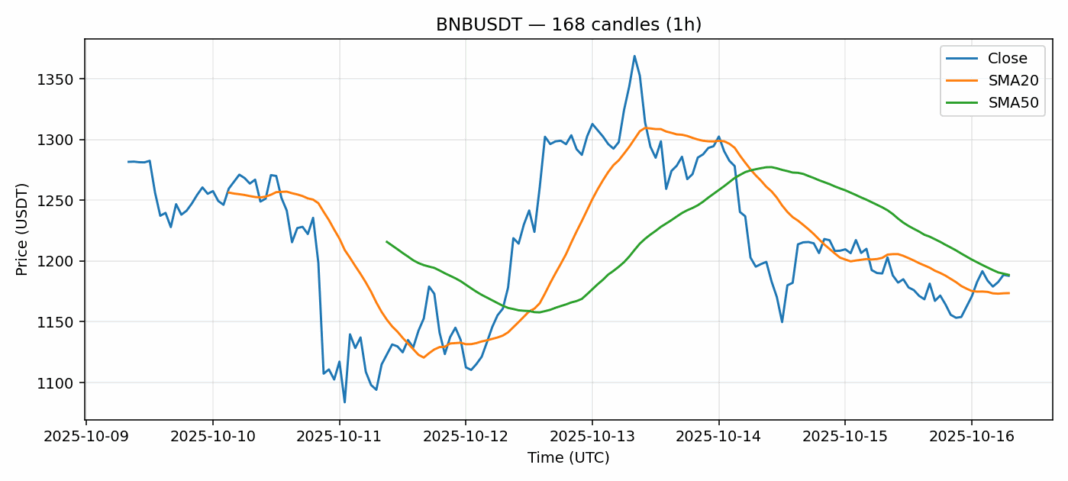
BNB is showing mixed signals at the $1,187 level, trading slightly below its 50-day SMA of $1,188.62 but holding above the 20-day SMA of $1,173.59, indicating near-term support remains intact. The RSI at 62.29 suggests BNB is approaching overbought territory but still has room for upward movement before hitting extreme levels. The modest 24-hour decline of 0.1% appears to be healthy consolidation after recent gains, particularly given the substantial $800 million trading volume supporting current price levels. Volatility at 6.75% indicates moderate price swings, typical for BNB during consolidation phases. Traders should watch for a decisive break above the $1,190 resistance level, which could trigger a move toward $1,220. Downside support sits at $1,170-$1,175, where buyers have previously stepped in. Given the technical setup, consider scaling into long positions on dips toward support with tight stops below $1,165.
Key Metrics
| Price | 1187.8000 USDT |
| 24h Change | -0.11% |
| 24h Volume | 799766886.80 |
| RSI(14) | 62.29 |
| SMA20 / SMA50 | 1173.59 / 1188.63 |
| Daily Volatility | 6.75% |
BNB — 1h candles, 7D window (SMA20/SMA50, RSI).


