Sentiment: Bearish
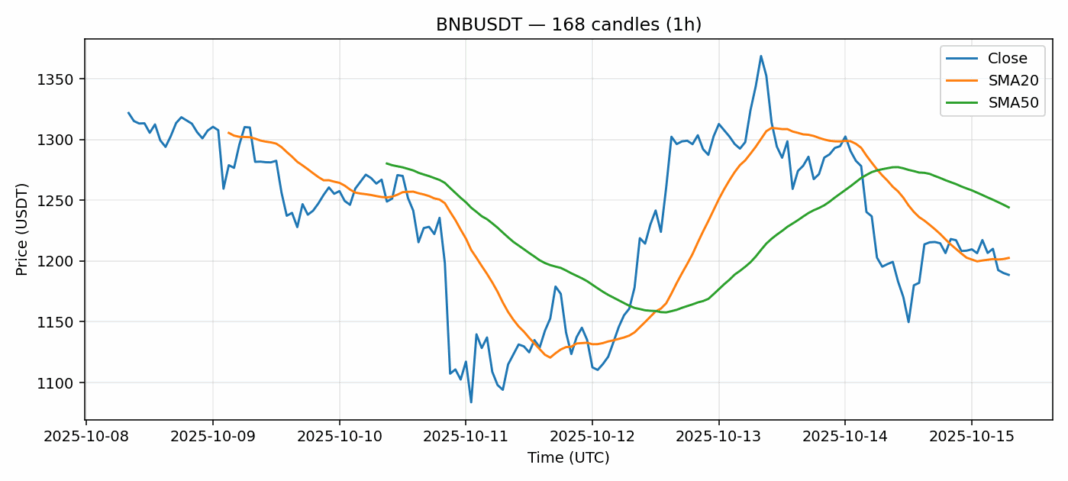
BNB is currently trading at $1,188.62, showing modest weakness with a 1.85% decline over the past 24 hours. The technical picture reveals several concerning signals despite some potential oversold conditions. The RSI reading of 33.39 indicates BNB is approaching oversold territory, which typically suggests limited downside from current levels. However, the price remains below both the 20-day SMA ($1,202.57) and 50-day SMA ($1,244.19), confirming the bearish trend structure. Trading volume remains substantial at $1.45 billion, suggesting active institutional participation. The elevated volatility reading of 6.94% indicates significant price swings are likely to continue. For traders, consider waiting for a confirmed break above the 20-day SMA before entering long positions. Short-term traders might find opportunities in the oversold bounce, but risk management remains crucial given the broader bearish technical structure. Support appears around $1,150-$1,170, with resistance at the $1,200-$1,220 zone.
Key Metrics
| Price | 1188.6200 USDT |
| 24h Change | -1.85% |
| 24h Volume | 1457409001.11 |
| RSI(14) | 33.39 |
| SMA20 / SMA50 | 1202.57 / 1244.19 |
| Daily Volatility | 6.94% |
BNB — 1h candles, 7D window (SMA20/SMA50, RSI).


