Sentiment: Bearish
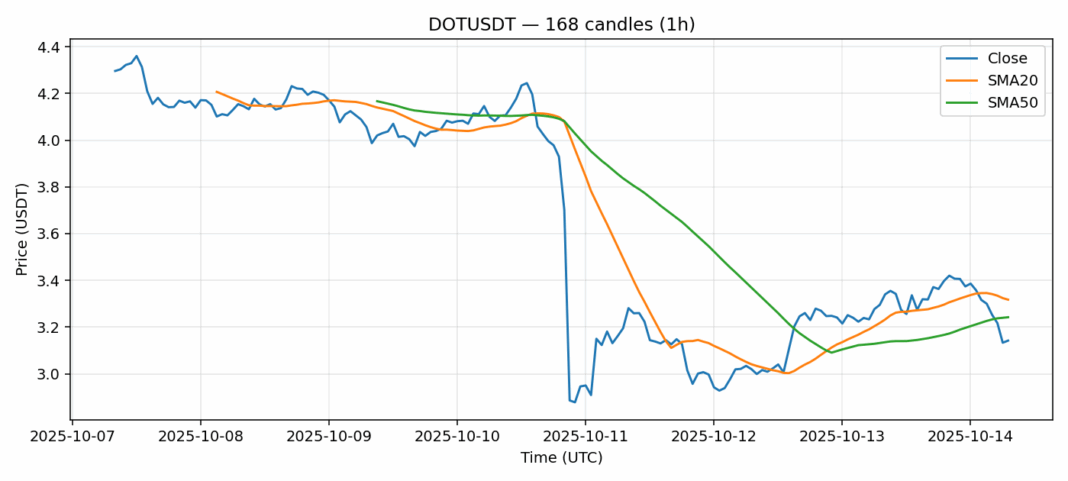
DOT is showing concerning technical signals as it trades at $3.145, down nearly 4% in the past 24 hours. The RSI reading of 20.26 indicates severely oversold conditions, typically suggesting potential for a short-term bounce. However, price remains below both the 20-day SMA ($3.32) and 50-day SMA ($3.24), confirming the bearish trend structure. Trading volume of $52 million suggests moderate participation in the current move. The high volatility reading of 11.4% indicates significant price swings, creating both risk and opportunity. For traders, consider waiting for RSI to recover above 30 before entering long positions, with tight stops below $3.00. Resistance sits near the $3.30-3.35 zone where the moving averages converge. Given the oversold conditions, aggressive traders might scale into small long positions here, but conservative traders should wait for confirmation of trend reversal.
Key Metrics
| Price | 3.1450 USDT |
| 24h Change | -3.97% |
| 24h Volume | 52226460.34 |
| RSI(14) | 20.26 |
| SMA20 / SMA50 | 3.32 / 3.24 |
| Daily Volatility | 11.41% |
Polkadot — 1h candles, 7D window (SMA20/SMA50, RSI).


