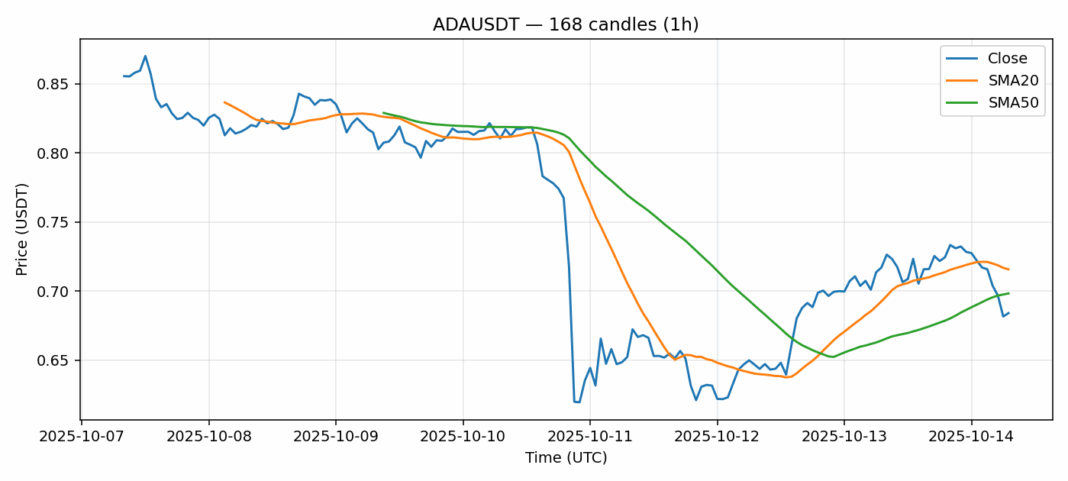
Sentiment: Bearish
ADA is showing significant technical stress as it trades at $0.6842, down 4.15% over 24 hours. The RSI reading of 21.36 indicates extreme oversold conditions rarely seen in healthy markets, suggesting potential for a technical bounce. However, ADA remains below both its 20-day SMA ($0.7158) and 50-day SMA ($0.6983), confirming the bearish trend structure. Trading volume of $189 million shows moderate participation in the sell-off, while elevated volatility at 8.19% signals ongoing uncertainty. Traders should watch for potential support around the $0.68 level, where we might see either consolidation or further downside. Aggressive traders could consider scaling into long positions with tight stops below $0.67, while conservative investors should wait for RSI recovery above 30 and a break above the 20-day SMA before entering. Risk management remains crucial given the elevated volatility environment.
Key Metrics
| Price | 0.6842 USDT |
| 24h Change | -4.15% |
| 24h Volume | 189258036.79 |
| RSI(14) | 21.36 |
| SMA20 / SMA50 | 0.72 / 0.70 |
| Daily Volatility | 8.19% |
Cardano — 1h candles, 7D window (SMA20/SMA50, RSI).


