Sentiment: Bearish
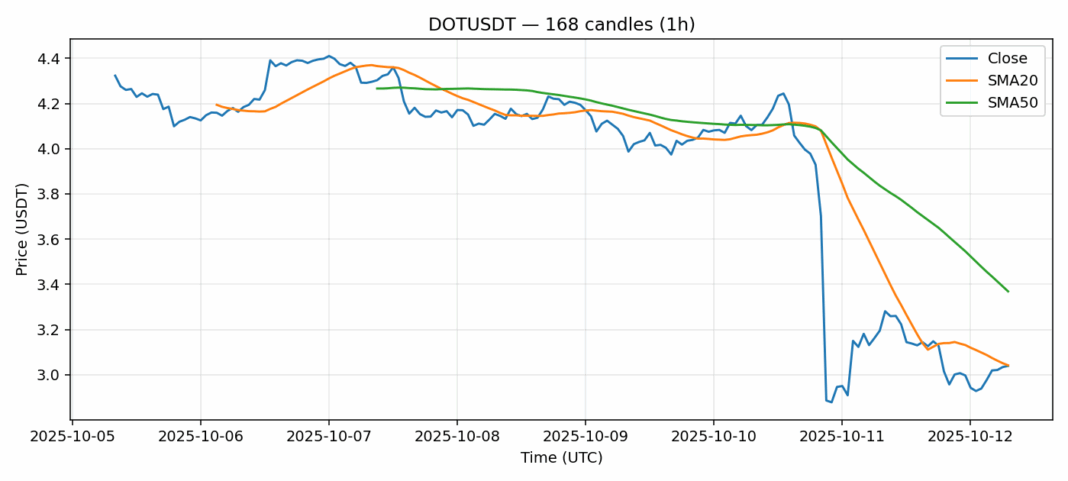
DOT is showing concerning technical weakness as it trades at $3.039, down 3.59% over the past 24 hours. The asset currently sits just below its 20-day SMA of $3.042, indicating near-term bearish momentum, while the significant gap below the 50-day SMA at $3.369 suggests persistent selling pressure. The RSI reading of 37.35 places DOT in oversold territory, which typically signals potential for a short-term bounce, though it hasn’t reached extreme oversold levels yet. Trading volume of $55.6 million appears moderate but insufficient to drive a meaningful reversal. Given the current technical setup, traders should consider waiting for confirmation of support around the $3.00 psychological level before entering long positions. A break below $3.00 could trigger further selling toward $2.80. For risk-tolerant traders, scaling into positions during oversold bounces with tight stop-losses makes sense, while conservative investors should wait for a clear break above the 20-day SMA with strong volume confirmation.
Key Metrics
| Price | 3.0390 USDT |
| 24h Change | -3.58% |
| 24h Volume | 55625946.24 |
| RSI(14) | 37.35 |
| SMA20 / SMA50 | 3.04 / 3.37 |
| Daily Volatility | 11.12% |
Polkadot — 1h candles, 7D window (SMA20/SMA50, RSI).


