Sentiment: Neutral
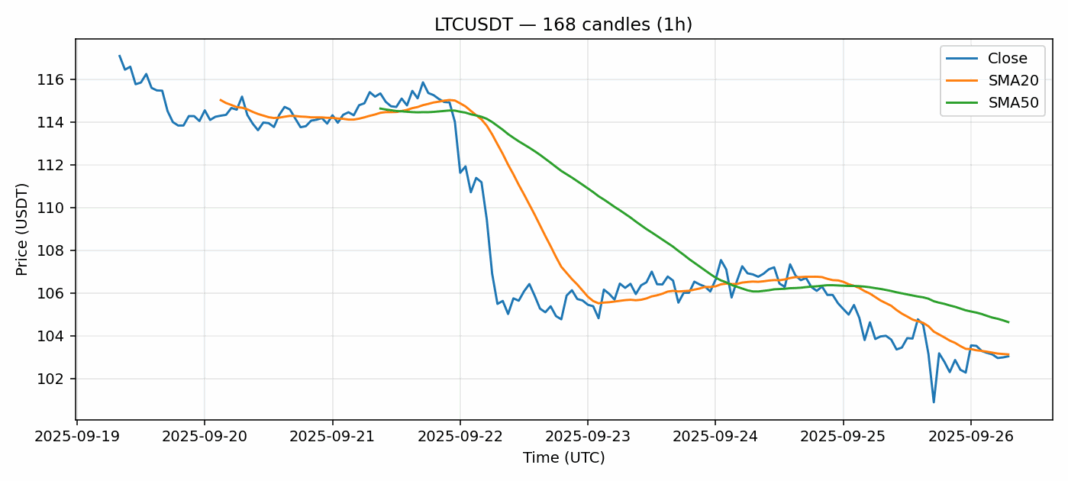
LTCUSDT is showing mixed signals at current levels. The price hovering around $103 places it just below the 20-day SMA ($103.13) and the 50-day SMA ($104.64), indicating potential resistance overhead. The RSI reading of 67 suggests LTC is approaching overbought territory but hasn’t crossed the critical 70 threshold yet. The 24-hour volume of $43.5 million shows decent participation, though the slight negative price movement (-0.69%) suggests some profit-taking. The volatility reading of 2.82% indicates relatively stable conditions for Litecoin. Traders should watch for a decisive break above the SMA cluster around $104-105 for bullish confirmation. A failure to hold above $102 could see a retest of the $100 psychological support. Position sizing should remain conservative until clearer direction emerges. Consider scaling into longs only on a confirmed breakout with volume expansion.
Key Metrics
| Price | 103.0400 USDT |
| 24h Change | -0.69% |
| 24h Volume | 43491928.93 |
| RSI(14) | 67.15 |
| SMA20 / SMA50 | 103.13 / 104.64 |
| Daily Volatility | 2.82% |
Litecoin — 1h candles, 7D window (SMA20/SMA50, RSI).


