Sentiment: Bearish
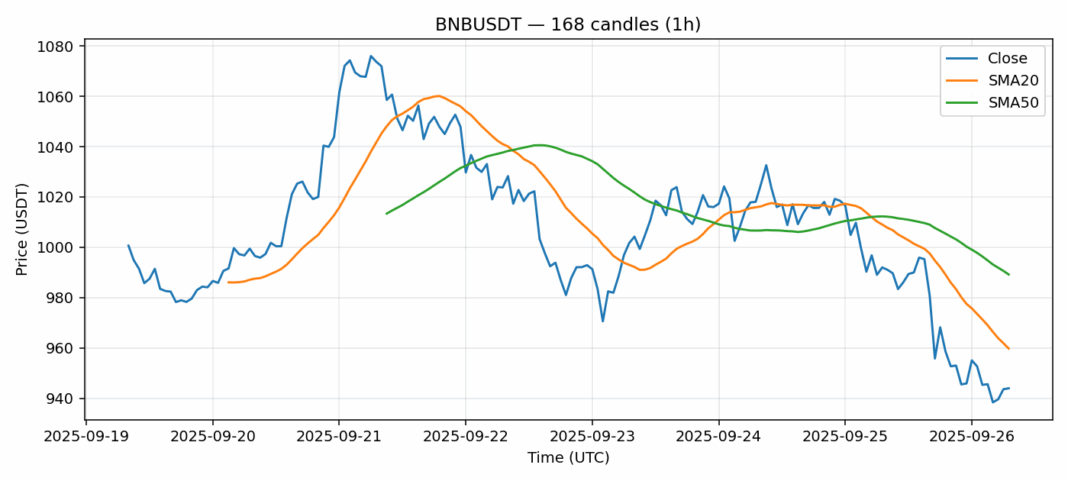
BNB is currently trading at $943.97, showing notable weakness with a 4.34% decline over the past 24 hours. The price sits below both the 20-day SMA ($959.78) and 50-day SMA ($989.19), indicating a bearish near-to-medium-term trend structure. However, the RSI reading of 41.3 suggests the asset is approaching oversold territory, which could attract dip-buyers looking for a potential bounce. The 24-hour volume of nearly $594 million shows decent participation in this move. Given the current technical setup, traders should watch for a potential reversal if BNB can reclaim the $950-$960 resistance zone. A break below $930 could trigger further selling toward the $900 psychological level. Consider scaling into long positions on weakness near $920 with tight stops, while aggressive traders might short rallies failing at the 20-day SMA.
Key Metrics
| Price | 943.9700 USDT |
| 24h Change | -4.34% |
| 24h Volume | 593628668.07 |
| RSI(14) | 41.30 |
| SMA20 / SMA50 | 959.78 / 989.19 |
| Daily Volatility | 3.27% |
BNB — 1h candles, 7D window (SMA20/SMA50, RSI).


