Sentiment: Bullish
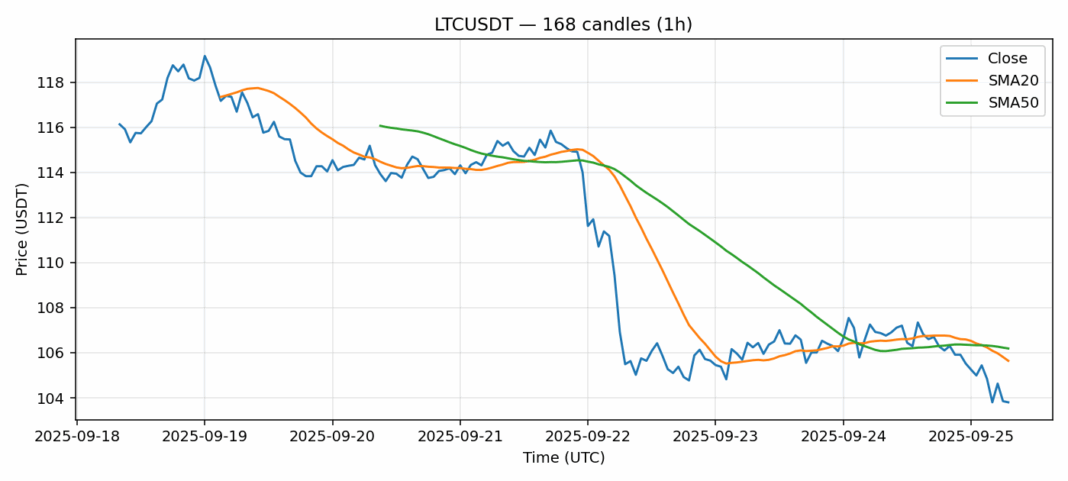
LTCUSDT is showing signs of capitulation with price at $103.8, down 2.9% in 24 hours. The RSI reading of 25 indicates severe oversold conditions, historically a precursor to bounces. Price currently trades below both the 20-day SMA ($105.64) and 50-day SMA ($106.19), confirming short-term bearish momentum. However, the widening gap between price and moving averages suggests potential mean reversion ahead. Volume remains healthy at $33.8M, indicating active participation. Traders should watch for bullish divergence on lower timeframes and consider scaling into long positions near $100 psychological support. Risk management is crucial – set stops below $95. A break above the 20-day SMA could signal trend reversal targeting $110-112 resistance. Accumulation at these levels appears favorable for swing trades.
Key Metrics
| Price | 103.8000 USDT |
| 24h Change | -2.90% |
| 24h Volume | 33816295.99 |
| RSI(14) | 25.26 |
| SMA20 / SMA50 | 105.64 / 106.19 |
| Daily Volatility | 2.55% |
Litecoin — 1h candles, 7D window (SMA20/SMA50, RSI).


