Sentiment: Neutral
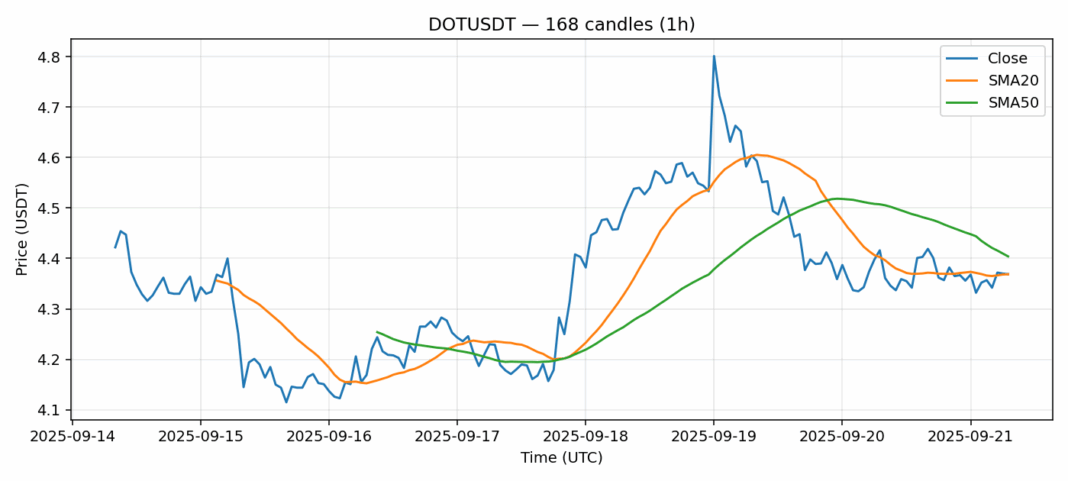
DOTUSDT is currently trading at $4.369, showing a slight decline of 0.546% over the past 24 hours. The price is hovering just above the 20-day SMA of $4.3686 but remains below the 50-day SMA of $4.40408, indicating near-term consolidation with a bearish tilt. The RSI reading of 42.7 suggests the asset is approaching oversold territory but hasn’t reached extreme levels yet. Trading volume of $23.6 million appears healthy, supporting current price levels. Given the current technical setup, I would advise caution for long positions until we see a decisive break above the 50-day SMA. Short-term traders might consider scalping opportunities near support levels, while swing traders should wait for clearer directional momentum. Keep a close eye on Bitcoin’s movement as it could influence DOT’s next move.
Key Metrics
| Price | 4.3690 USDT |
| 24h Change | -0.55% |
| 24h Volume | 23632854.13 |
| RSI(14) | 42.73 |
| SMA20 / SMA50 | 4.37 / 4.40 |
| Daily Volatility | 4.12% |
Polkadot — 1h candles, 7D window (SMA20/SMA50, RSI).


