Sentiment: Bullish
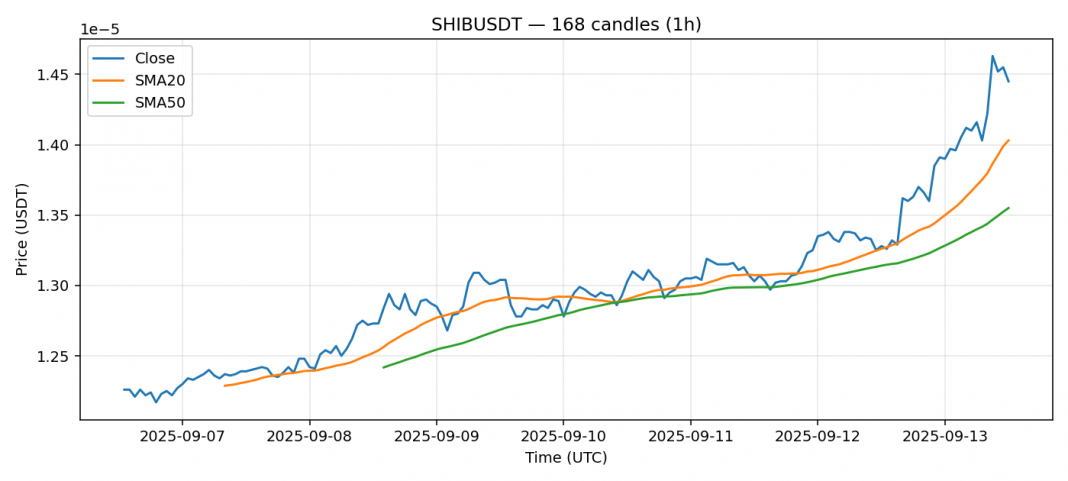
SHIBUSDT is showing strong momentum with a 9.06% surge over the past 24 hours, currently trading at $0.00001445. The price is above both the 20-day SMA ($0.00001403) and 50-day SMA ($0.00001355), indicating a bullish trend structure. However, the RSI reading of 72 suggests the asset is approaching overbought territory, which could signal a near-term pullback. Volume remains robust at over $61 million, supporting the current price action. Given the elevated volatility of 2.64%, traders should exercise caution with position sizing. My advice would be to consider taking partial profits near current levels while maintaining a stop-loss below the 20-day SMA. Wait for a potential retracement to the $0.00001380-$0.00001400 zone for better risk-reward entry opportunities if bullish momentum continues.
Key Metrics
| Price | 0.0000 USDT |
| 24h Change | 9.06% |
| 24h Volume | 61523414.11 |
| RSI(14) | 72.06 |
| SMA20 / SMA50 | 0.00 / 0.00 |
| Daily Volatility | 2.64% |
Shiba Inu — 1h candles, 7D window (SMA20/SMA50, RSI).


