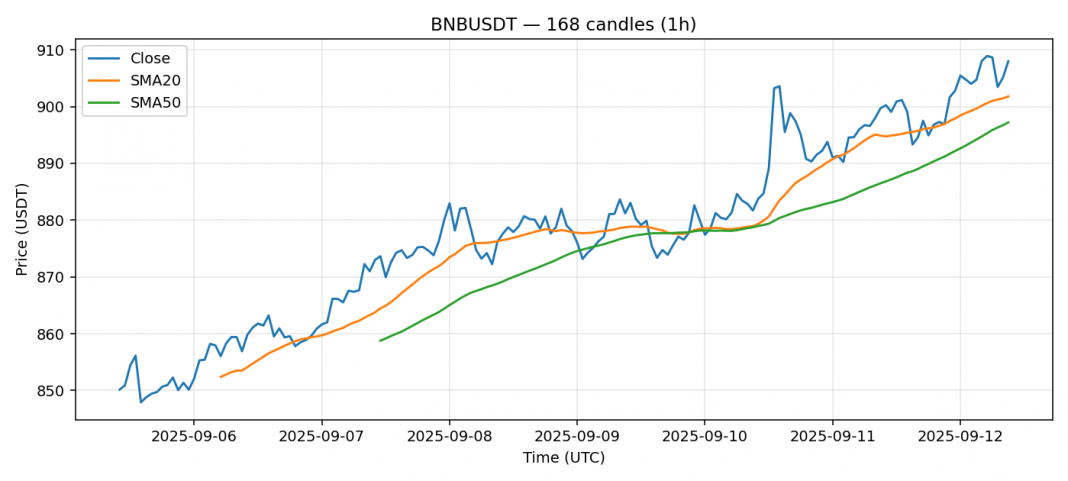
Sentiment: Bullish
BNB is showing strength, trading at $907.98 with a 1.29% gain over the past 24 hours. The price is currently above both the 20-day SMA ($901.79) and 50-day SMA ($897.20), indicating a bullish trend structure. However, the RSI reading of 71.67 suggests the asset is approaching overbought territory, which could signal a potential pullback. Volume remains healthy at $187M, supporting the current price action. Given the elevated RSI and moderate volatility of 1.4%, I’d advise caution on new long positions at these levels. Wait for a pullback toward the $900 support zone before adding exposure, or consider taking partial profits if holding from lower levels. The overall trend remains intact, but risk management is crucial here.
Key Metrics
| Price | 907.9800 USDT |
| 24h Change | 1.29% |
| 24h Volume | 187418995.28 |
| RSI(14) | 71.67 |
| SMA20 / SMA50 | 901.79 / 897.20 |
| Daily Volatility | 1.40% |
BNB — 1h candles, 7D window (SMA20/SMA50, RSI).


